Plotting Conic Sections
Plotting Conic Sections
Plotting conic sections using cartesian coordinates is simple when you have the equation of the conic section and understand what this equation tells you about the conic section itself.
Circle
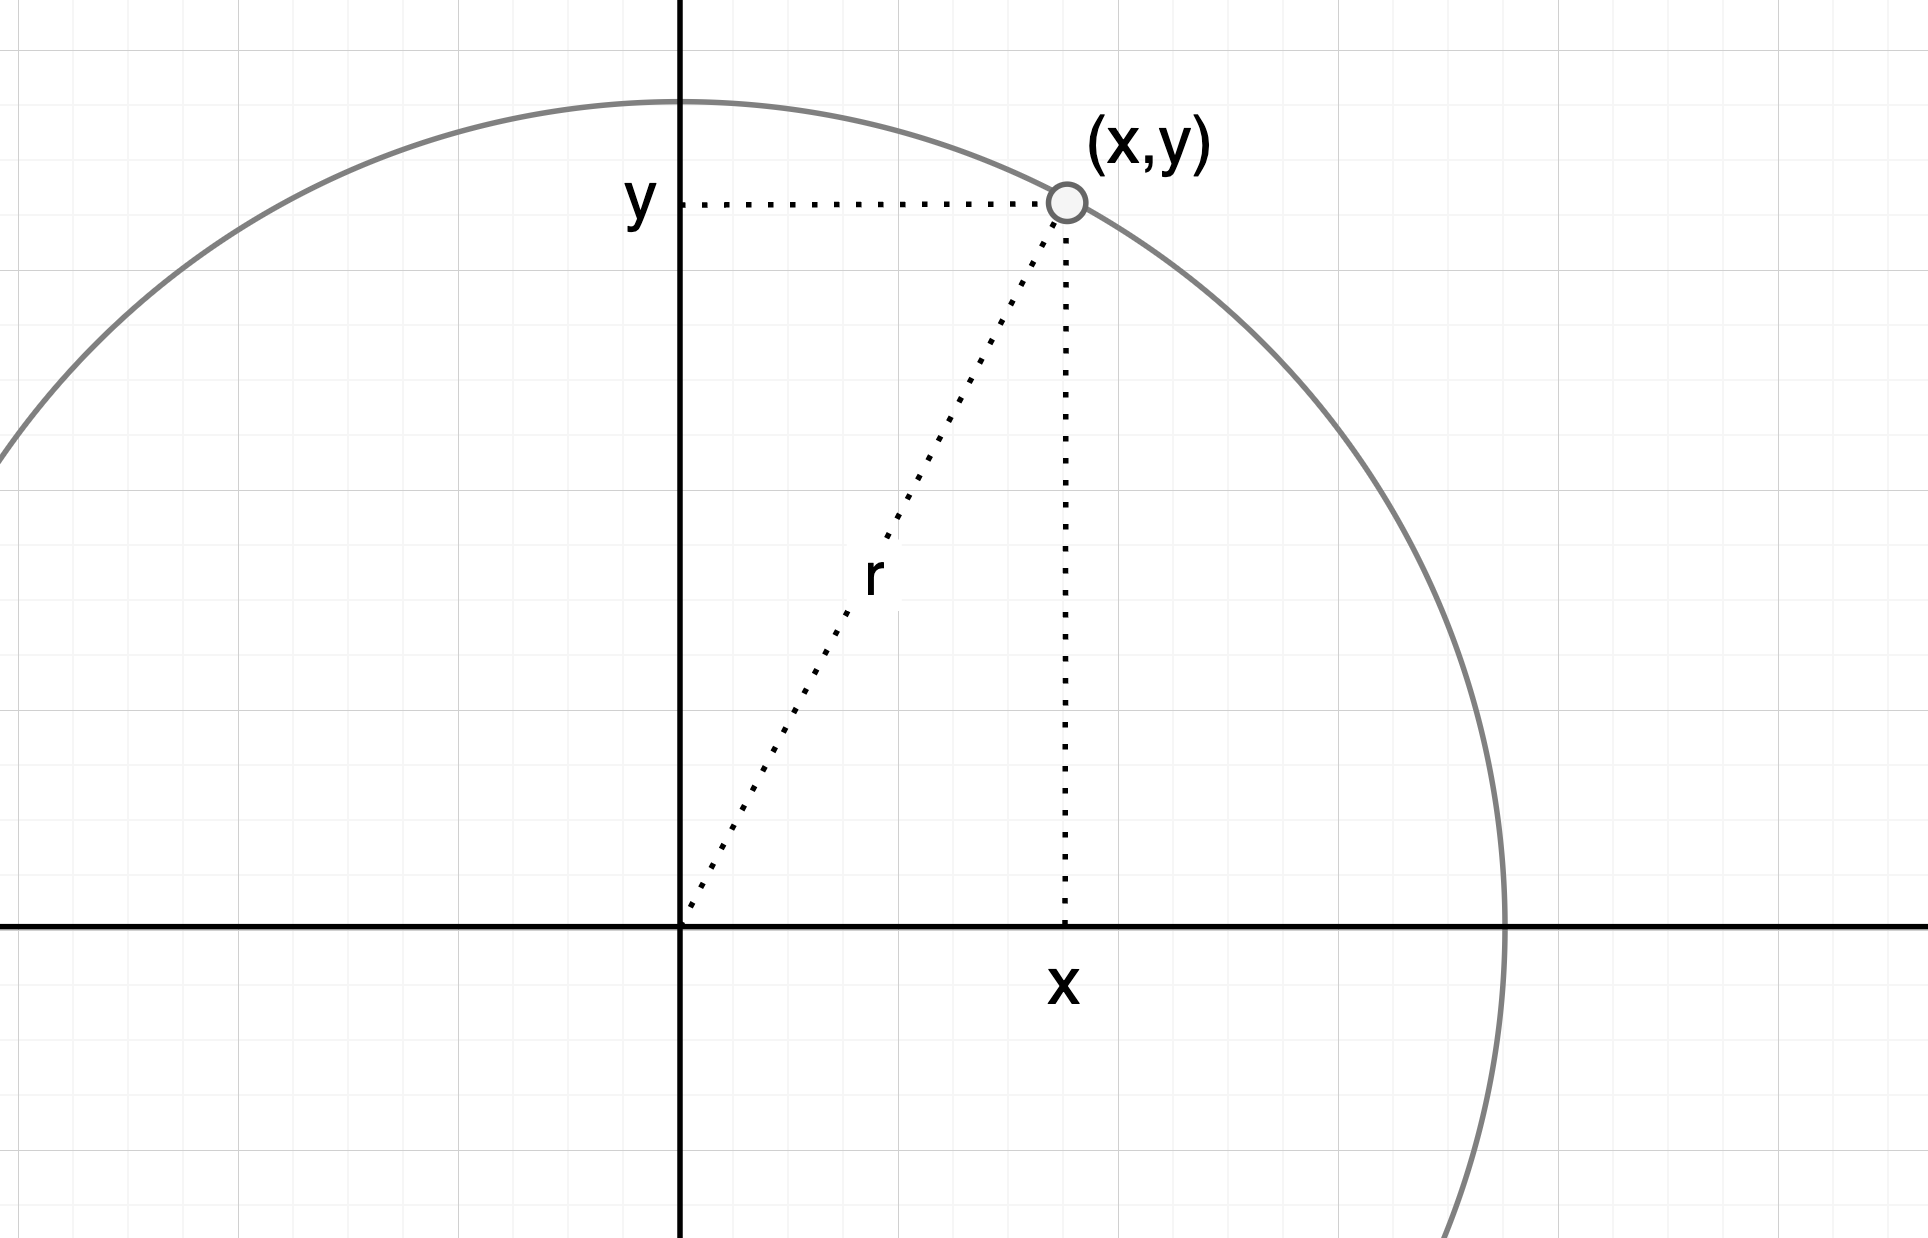
For circles, the equation always takes the form of \( (x + x_1)^2 + (y + y_1)^2 = r^2 \), where the centre of the circle is \((x_1,y_1)\) and the radius is \(r\). The equation for the unit circle is \( x^2 + y^2 = 1 \), as this has a radius of \(1\) and is centred at the origin. To understand why the equation of a circle takes the form that it does, it is important to think about the radius of the circle, which must be constant. The radius, as can be seen in diagram, is the hypotenuese of a right angled triangle created by the \(x\) and \(y\) coordinates. Using Pythagoras to determine the length of the radius, we get that \( x^2 + y^2 = r^2 \) must be true for any point on the circle.
Ellipse
An ellipse is slightly more complicated than a circle, because it has few extra elements to it. This diagram (by Ag2gaeh - Own work, CC BY-SA 4.0) is really helpful as it displays all the terms in one place.
 To keep things simple, we can think of the equation of an ellipse with its centre at the origin. We know that, in order to comply with the definition of an ellipse,
Research links
- Project URL www.example.com
- Project URL www.example.com
- Project URL www.example.com
- Project URL www.example.com